
By John Carney and Alex Marlow
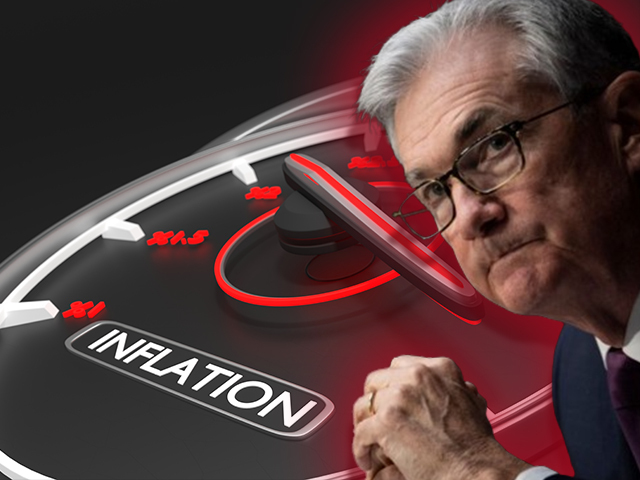
The Federal Reserve’s fight against inflation has faltered.
The Department of Labor reported on Thursday that the consumer price index climbed 0.4 percent from a year ago, which annualizes to 4.9 percent. That’s a slowdown in the month-to-month figure compared with August but still uncomfortably high and worse than the 0.3 percent expected by Wall Street.
The year-over-year number showed inflation going nowhere fast. The consumer price index (CPI) rose 3.7 percent compared with September of last year, exactly the same as the 12-month increase recorded in August. So, progress on headline inflation has stalled.

The story is largely the same for so-called “core inflation,” the measure that excludes food and energy costs. Core CPI rose 0.3 percent for the month, exactly the same as it did in August and matching the Wall Street consensus forecast. That annualizes to a 3.9 percent rate of inflation. The year-over-year CPI gain edged down to 4.1 percent from 4.3 percent, in line with expectations.
Comparing the one-month annualized number to the year-over-year figure is a useful exercise to determine how the current rate compares to what we’ve seen over the past year. This tells us that the September headline suggests inflation is worse than the average over the last 12 months while core is slightly—but only slightly—better.
More evidence that disinflation has run out of steam can be seen in the three-month annualized figures, a data point many economists look to for evidence of an underlying trend in inflation. Unfortunately, the trend for headline inflation is flat—meaning inflation is not coming down. The three-month annualized increase in CPI is 4.9 percent, exactly the same as the one-month figure.
Things are a bit brighter for core CPI, where the three-month annualized figure is 3.1 percent. But even that might not be great news because the fact that the one-month annualized figure is higher may indicate an upward break-out in inflation.
The Message in the Median
Although the breakdown of the disinflationary pressures in September was more powerful than Wall Street expected, the measures of underlying inflation from the Federal Reserve Bank of Cleveland have been telegraphing this for quite some time. The monthly increase in median CPI was 0.4 percent for four consecutive months through June. There was a big drop in July to 0.2 percent but then a return to 0.3 percent in August. As we have explained over the months, this persistent lack of sustained progress in median CPI suggested that inflation was becoming sticky at a high level.
The 16 percent trimmed-mean CPI calculated by the Cleveland Fed was telling the same story. This rose 0.2 percent in March, 0.3 percent in April, and then held at 0.2 percent for three consecutive months through July. In August, it ticked back up to 0.3 percent.
The reason we point toward median and 16 percent trimmed mean inflation each month is that we think the trend in these figures is a leading indicator for where inflation is going. They have been very good guides throughout this inflationary period.
“This [trend in median CPI] suggests that inflation is unlikely to come down by much more in the months to come,” we explained back on July 12.
In September we wrote:
“Looking at the month-to-month changes in median CPI, we see that there has been no downward trend at all. After registering 0.6 percent in February, median CPI clocked in at 0.4 percent for four months in a row. It fell in July down to a more moderate 0.2 percent but is likely to climb again when the August numbers are released later this week.
Inflation, in other words, has proven stickier than most economists expected or the Biden administration hoped.”
And for those readers who missed it, here is our analysis from May:
Our preferred measures of underlying inflation, which we think points to the likely direction of inflation in the near future, is the Cleveland Fed’s median CPI and 16 percent trimmed mean CPI metrics. Median CPI rose 0.4 percent in April, exactly as it did in March. The alignment of median CPI, core CPI, and headline CPI suggests that inflation is no longer being driven by outliers but has converged on a central tendency and is likely to remain sticky at this elevated level.
Over the past 12 months, median CPI is up seven percent. Since December, when median CPI was also seven percent, this has been stuck in a range between seven percent and 7.2 percent. In other words, there’s no sign of underlying progress. And the fact that median is above the headline and core suggests that the underlying pressures remain strong. That means the risk to inflation remains to the upside.
So what do the latest median and trimmed-mean inflation figures tell us?
Median CPI rose 0.5 percent compared with a month ago, which annualizes to 5.6 percent. So, once again, the median is above the headline and the core, suggesting underlying inflation is quite strong and pointing to upside risk for inflation going forward.
The 16 percent trimmed mean inflation gauge rose to 0.4 percent in September, the highest it has been since February. This annualizes to 4.9 percent. So, 16 percent confirms the trend we’ve seen in median of upward underlying inflation pressure.
Biden Declares Victory…Again
The Biden White House is of course celebrating the September numbers as a great victory for “Bidenomics in action.”
“This morning’s report shows core inflation fell to its lowest level in two years. Overall inflation is down by 60% from its peak at a time when unemployment has remained below 4% for 20 months in a row and the share of working-age Americans in the workforce is the highest in 20 years. That’s Bidenomics in action,” the White House said.
At this point, we’ve lost count of how many times the White House has declared victory over inflation. To its credit, however, the White House was far more restrained than the usual suspects, who quickly jumped to point out that inflation has been totally defeated once you exclude food, energy, shelter, and used cars (which actually were disinflationary this month).
Excluding specific items from inflation is a time-honored tradition that can be traced as far back as Fed Chairman Arthur Burns, who was convinced that nearly all inflation measures were distorted by idiosyncratic factors that needed to be excluded from economic analysis. So, he excluded oil prices when the OPEC oil embargo sent those skyrocketing. And when food prices surged, perhaps because of El Nino, he excluded those too. Eventually, prices of mobile homes, women’s jewelry, children’s toys, and used cars were excluded. Eventually, only about 35 percent of CPI was left, according to economist Stephen Roach, who worked at the Fed at the time.
Critics joked that Burns had discovered a unique solution to inflation: once you exclude things that go up in price, inflation vanishes.
Of course, the Burns approach was a disaster and led to the Fed badly underestimating how high inflation would go and how entrenched it would become in the economy.
By our quick back-of-the-envelope calculation, excluding the things Paul Krugman decides to give the Arthur Burns treatment leaves only about 42 percent of CPI left over. So, he’s declaring victory over inflation based on the average prices of less than half of the basket of consumer goods and services that goes into inflation.
As it turns out, it was a rebellion against Burnsian CPI that led to the creation of median CPI. “I remember a morning in 1991 at a meeting of the Federal Reserve Bank of Cleveland’s board of directors. I was welcomed to the lectern with, ‘Now it’s time to see what Mike is going to throw out of the CPI this month.’ It was an uncomfortable moment for me and it had a lasting influence. It was my motivation for constructing the Cleveland Fed’s median CPI,” explained economist Michael Bryan, who has since moved on to the Atlanta Fed, in remarks at a 2014 conference on inflation at the Cleveland Fed.